Research on visual analysis of spatio-temporal data at Fraunhofer AIS: an overview
of history and functionality
of CommonGIS
Gennady Andrienko and Natalia Andrienko
Fraunhofer Institute AIS
http://www.ais.fraunhofer.de/and
gennady.andrienko@ais.fraunhofer.de
The roots of our approach to building interactive Internet-based systems
for visual data analysis and electronic publishing of spatial maps and data originate
from the software system IRIS (Information Retrieval Intelligent System) that
was developed for Windows in the early nineties [1]. IRIS was implemented in
C++. IRIS already realized several innovative ideas [2]:
1.
Concept of
interactive maps that change their appearance in real-time upon user’s
activation of interactive manipulators (see figures 1 and 2).
2.
Knowledge-based
approach for the automated selection of map symbolism depending on data
characteristics and user’s needs.
3.
Dynamic
linking between maps and statistical graphics displays (brushing).
The development of IRIS
continued by applying the Java programming language and environment for the
Internet. IRIS, then
renamed to Descartes, became one of the first interactive mapping systems
available in the Internet [3]. As early as September 1996, it was included to
the Top 1% web applets and Top 10 web applets lists by the
independent Java Applet Rating Service (URL http://www.jars.com/).
In 1998-2001 the further development continued
in the framework of ESPRIT project 28983, CommonGIS [4], which was proposed and coordinated by AIS.
In the course of the project, the software was finally renamed to CommonGIS.
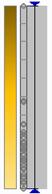
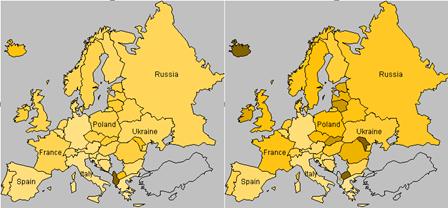
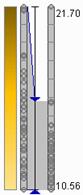
Figure 1. Effect
of outlier removal (focusing). Due to a very high value of the birth rate in
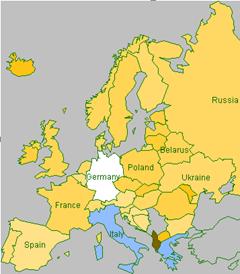
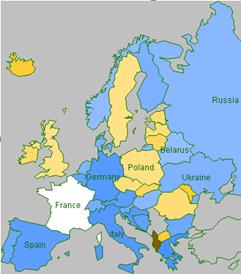
Figure 2. Visual
comparison technique. On the left, the birth rate in
CommonGIS is unique among both commercial and research
software systems as a unique composition of well-integrated tools, which can
complement and enhance each other thus allowing sophisticated analyses. The
system includes various methods for cartographic visualisation, non-spatial
graphs, tools for querying, search, and
classification, and computation-enhanced visual techniques. A common feature of
all the tools is their high user interactivity, which is essential for
exploratory data analysis.
The main features of CommonGIS are the
following:
1.
Powerful
tools for Internet mapping that support a variety of standard formats of map
and table data.
2.
A flexible
client-server architecture that optimises download time and supports
integration of data from network-distributed servers.
3.
A variety
of interactive mapping techniques combined with statistical graphics displays
and computations.
4.
Comprehensive
tools for analysis of spatial time-series, including animated maps, time-aware
map visualizations, and statistical graphics displays [5,6].
5.
Novel
information visualization tools (dynamic query, table lens, parallel coordinate
plots etc.) dynamically linked to maps and graphics via highlighting,
selection, and brushing.
6.
Tools for
interactive multi-criteria decision making and sensitivity analysis for
individuals [7] and small groups [8] of decision makers. Recently we developed
interactive methods that support various styles and procedures of informed decision
making [9].
7.
Possibility
to complement interactive visual data analysis by mathematical methods of
statistics and data mining [10].
8.
A
prototype of intelligent user guidance (task support module) [11] that helps
users to follow problem solving scenarios and utilise all tools of interactive
graphics for selected data analysis and decision making problems.
9.
Original
methods of applying multivariate graphics (in particular, parallel coordinates
plots) to the analysis of spatial data [12,13]. Also,
original methods for calculating degrees of similarity in multidimensional
attribute space are available.
10.
Space-time
cube display for analysis of spatio-temporal events
and other kinds of multidimensional data (figure 3, [14]).
11. Tools for interactive aggregation of grid data
tightly coupled with dynamic visualization of aggregation results (figure 4,
[15]).
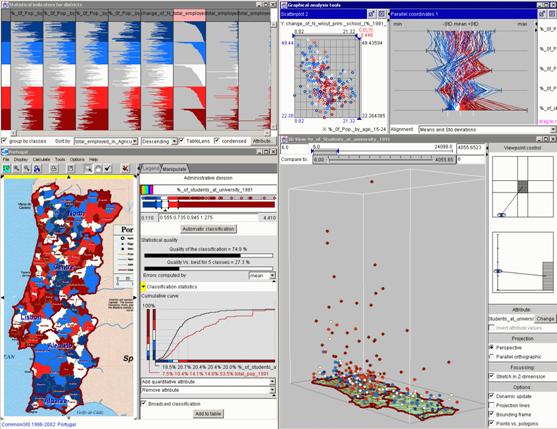
Figure 3.
Multiple dynamically linked displays, including space-time cube.
The development of CommonGIS and its
predecessors has always been oriented towards user’s needs. To ensure the
friendliness of the user interface several usability tests were performed [16].
Their results demonstrated that only short training is sufficient for
understanding and memorising the handling of the novel, and sometimes – but
only prima facie - sophisticated looking tools, and their successful
utilisation in problem solving. Our general experience is that new users must
first learn and “feel” the very high interactivity of the direct manipulation
tools of CommonGIS by way of some examples. A short
introduction of 30 to 60 minutes, and some hands-on experience, would generally
induce enough fun and courage so that users can continue with their own
exploration of the further tools and mechanisms.
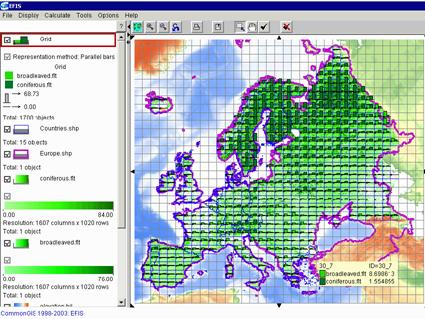
Figure 4. Data derived from two grids are represented by bar charts. If a resolution of aggregation is changed, the map will be automatically rebuilt.
A commercial version of the CommonGIS software
is released by the SPADE – spatial decision support department of Fraunhofer
AIS, see www.commongis.com for details.
Universities and schools can still order free licences from the same site for
research and educational use.
We continue designing and developing research prototypes in the
following directions:
- Further
development of methods and tools for analysis of spatio-temporal
and multidimensional data.
- Advancing interactive
tools for dynamic aggregation and visual analysis of spatially- and
temporally-related thematic information.
- Creating scalable
information visualization techniques that can work with very large data
sets.
- Interfacing
to public-domain data mining tools; creating interactive visualization
support to a number of data mining methods available in open-source external
software packages.
- Research and
development for creation of tools for documenting the data analysis
process and supporting construction of knowledge in the result of data
analysis.
- Advancing
support for a variety of multi-criteria decision making problems and
scenarios.
Our ultimate goal is to generalise our experience in designing methods
and tools and thus build a theory of data analysis and decision making with the
use of interactive information graphics displays. As a first step towards such a
theory, we developed a classification of analysis tasks for time-related
problems [17].
Acknowledgements
We are grateful to our colleagues P.Gatalsky, I.Denisovich, and M.Ostrovsky for their help in implementation of some of the
techniques mentioned in this paper, and for fruitful discussions and friendly
support. Partners in numerous R&D projects (CommonGIS,
SPIN!, GIMMI, EuroFigures,
EFIS, NEFIS, CHCC, SILVICS etc.) significantly influenced our work.
References
1. Andrienko, G. and
Andrienko, N. Intelligent Cartographic
Visualization for Supporting Data Exploration in the IRIS System, Programming
and Computer Software,1997, v.23 (5), pp 268-282
2. Andrienko, G. and
Andrienko, N. Interactive Maps for
Visual Data Exploration, International Journal Geographical Information
Science, 1999, v.13
(4), pp.355-374
3. Andrienko, G. and
Andrienko, N. IRIS: a Tool to Support
Data Analysis with Maps, In Goodchild, M., Egenhofer, M., Fegeas, R., and Kottman, C. (eds.) Interoperating Geographic Information Systems,
4. G. Andrienko, N.
Andrienko, and H. Voss, GIS for
Everyone: the CommonGIS project and beyond, M.Peterson (ed.), Maps and the Internet, Elsevier Science, 2003, pp. 131-146
5. N. Andrienko, G. Andrienko, and P. Gatalsky,
Tools for Visual Comparison of Spatial Development Scenarios, In Banissi, E. et al (Eds.) IV 2003. Seventh International
Conference on Information Visualization, Proceedings, 16-18 July, 2003,
6. Andrienko, N., Andrienko, G.,
Interactive Visual Tools to Explore Spatio-Temporal
Variation, In Proceedings AVI 2004
(accepted)
7. Jankowski, P.,
Andrienko, N., and Andrienko, G. Map-Centered Exploratory Approach to Multiple Criteria Spatial
Decision Making, International Journal Geographical Information Science,
2001, v.15 (2), pp.101-127
8. Gennady Andrienko, Natalia Andrienko, and Piotr
Jankowski, Building Spatial Decision
Support Tools for Individuals and Groups, Journal of Decision Systems,
2003, v. 12 (2), pp.193-208
9. Andrienko, N., Andrienko, G., Informed Spatial Decisions through
Coordinated Views, Information Visualization, 2003, v.2 (4), pp. 270-285
10. Andrienko, N.,
Andrienko, G., Savinov, A., Voss, H., and Wettschereck, D. Exploratory
Analysis of Spatial Data Using Interactive Maps and Data Mining, Cartography
and Geographic Information Science, 2001, v.28 (3), pp. 151-165
11. Andrienko, N. and
Andrienko, G. Intelligent Support for
Geographic Data Analysis and Decision Making in the Web, Journal of
Geographic Information and Decision Analysis, 2001, v.5 (2), pp.115-128
12. Andrienko, G. and
Andrienko, N. Exploring Spatial Data
with Dominant Attribute Map and Parallel Coordinates, Computers, Environment
and Urban Systems, 2001, v.25
(1), pp.5-15
13. Andrienko, G. and
Andrienko, N. Constructing Parallel
Coordinates Plot for Problem Solving, A.Butz, A.Krüger, P.Oliver, and M.Zhou (Eds.) 1st
International Symposium on Smart Graphics, New York, USA, ACM Press,
2001, pp.9-14
14. Andrienko, N.,
Andrienko, G., Voss, H., Bernardo, F., Hipolito, J.,
and Kretchmer, U. Testing the Usability of Interactive Maps in CommonGIS,
Cartography and Geographic Information Science, 2002, v.29 (4), pp.325-342
15. Peter Gatalsky, Natalia Andrienko, and Gennady Andrienko, Interactive
Analysis of Event Data Using Space-Time Cube, Submitted to Information
Visualization 2004 in
16. Andrienko, G., Andrienko, N., and Denisovich,
17. Natalia Andrienko, Gennady Andrienko,
and Peter Gatalsky, Exploratory Spatio-Temporal Visualization: an
Analytical Review, Journal of
Visual Languages and Computing, 2003, v.14 (6), pp. 503-541