
Data mining algorithms for discovery of frequent subsequences (also called motifs) in sequences of symbols can be useful in analyzing eye movements. By means of spatial generalization, eye trajectories can be transformed into sequences of visited generalized places (areas). Sequence mining algorithms can find repeated subsequences in a set of these sequences, i.e., repeated sequences of visited places. Among these repeated sequences there may be repeated movements forth and back between two places or even larger loops including three or more places. The presence of such cyclic subsequences indicate users' difficulties in interpreting the image and/or performing the given task.
In the example presented below, we use the sequence mining algorithm TEIRESIAS. The space of the tree diagram that served as a visual stimulus has been divided into generalized places (areas) as shown below left. The eye trajectories of the users have been represented as sequences of identifiers of the places. These sequences have been fed to TEIRESIAS. The parameters of the algorithm include the minimum motif length and minimum support (number of occurrences). In our example, we use the parameter values 4 and 5, respectively. In 37 generalized eye trajectories, the algorithm finds 49 repeated subsequences, some of which include wildcards. A wildcard is a special symbol (dot) indicating that an arbitrary symbol may occur in the corresponding position in the sequence. 27 of the discovered sequences do not include wildcards, 13 sequences include one wildcard, and 9 sequences include two wildcards. The maximum sequence length without wildcards is 5.
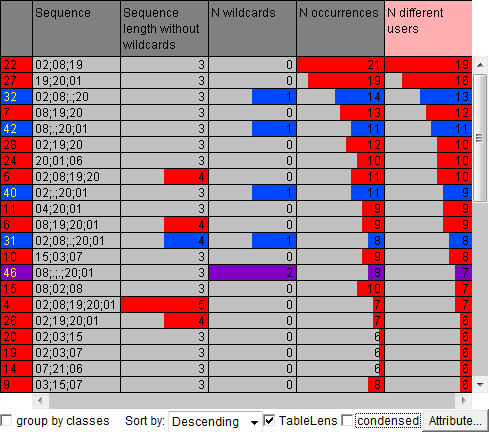
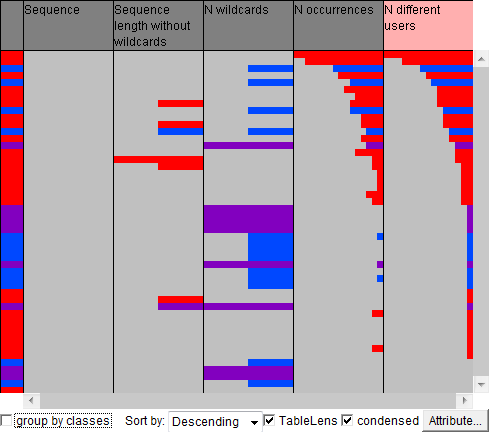
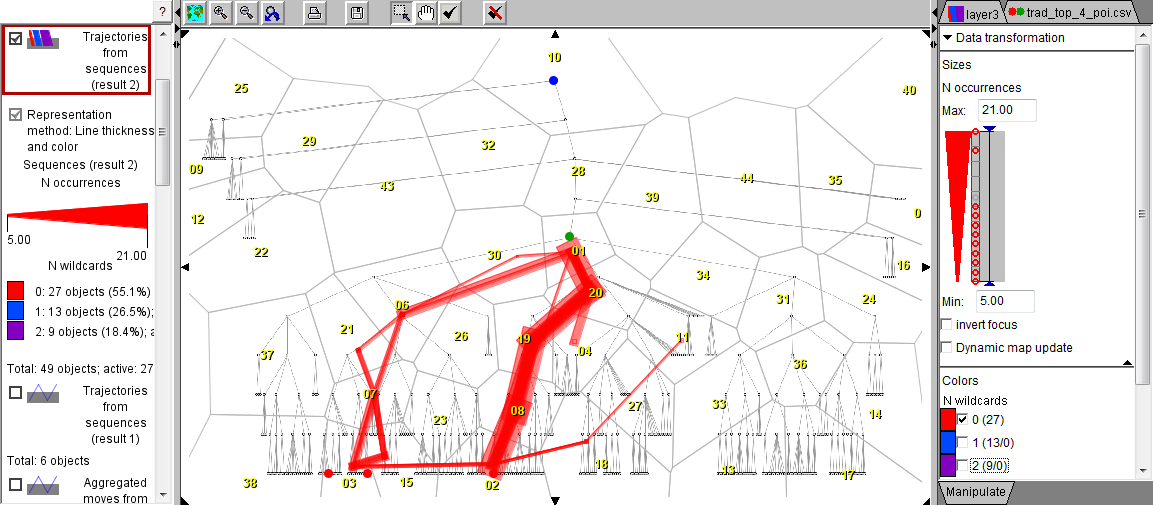
The results of the motif discovery algorithm are presented in the table view below. Each row describes one repeated subsequence. The rows are coloured according to the number of wildcards in the respective subsequences: red is used for the subsequences without wildcards, blue for the subsequences with a single wildcard, and purple for the subsequences with two wildcards. The rows are sorted according to the number of the users in whose eye trajectories the subsequences occurred. On the right, the table is shown in a "condences" form so that all rows are visible but without details.
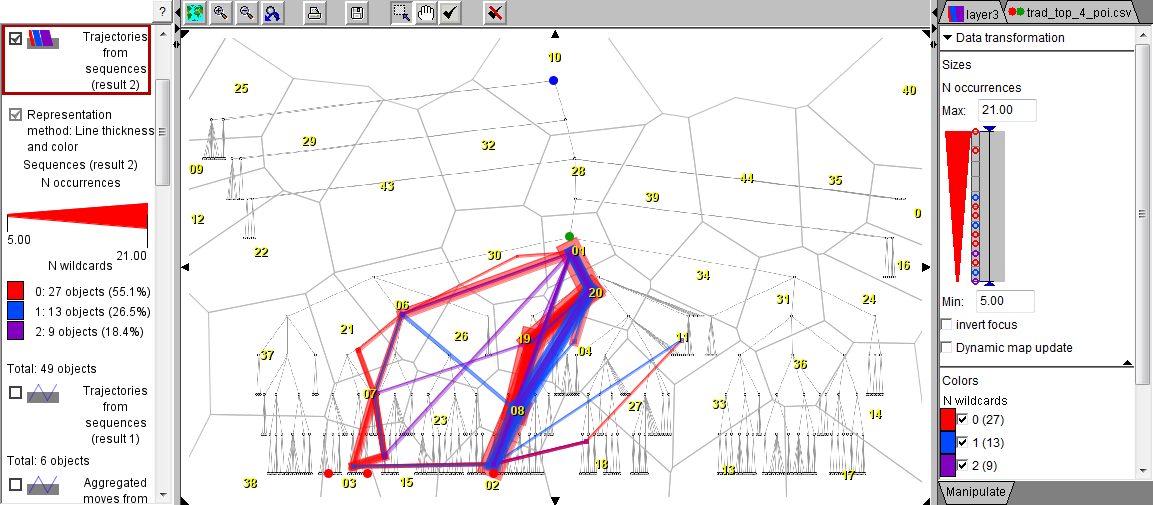
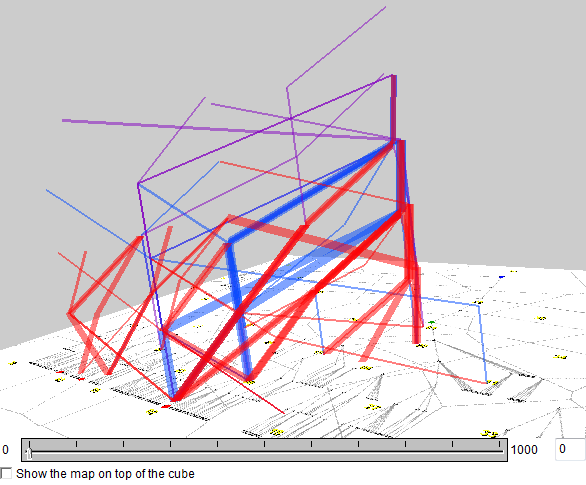
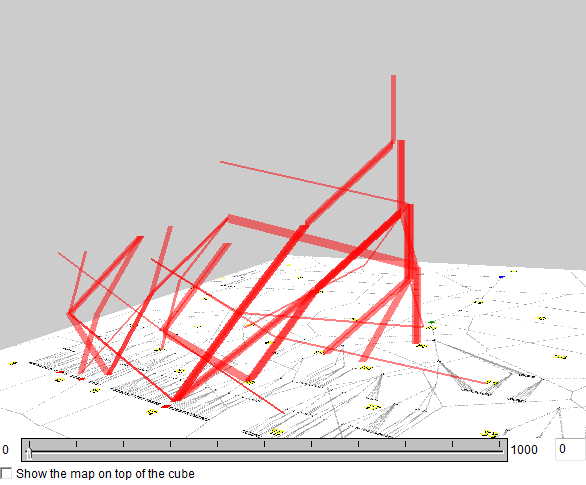
The discovered frequent subsequences can be represented as generalized trajectories in the diagram space, which allows visualizing them on a map of trajectories and in a space-time cube. The positions in the trajectories are the areas whose identifiers appear in the sequences. All trajectories receive the same start time and equal time intervals between the positions. To represent a wildcard, the previous position is duplicated, since there is no valid spatial position that could meaningfully represent a wildcard. The map and space-time cube below represent all discovered subsequences by lines with the colors corresponding to the number of wildcards and the thickness proportional to the number of occurrences of the subsequence.
The subsequences with wildcards can be filtered out. The images below represent only the subsequences without wildcards.
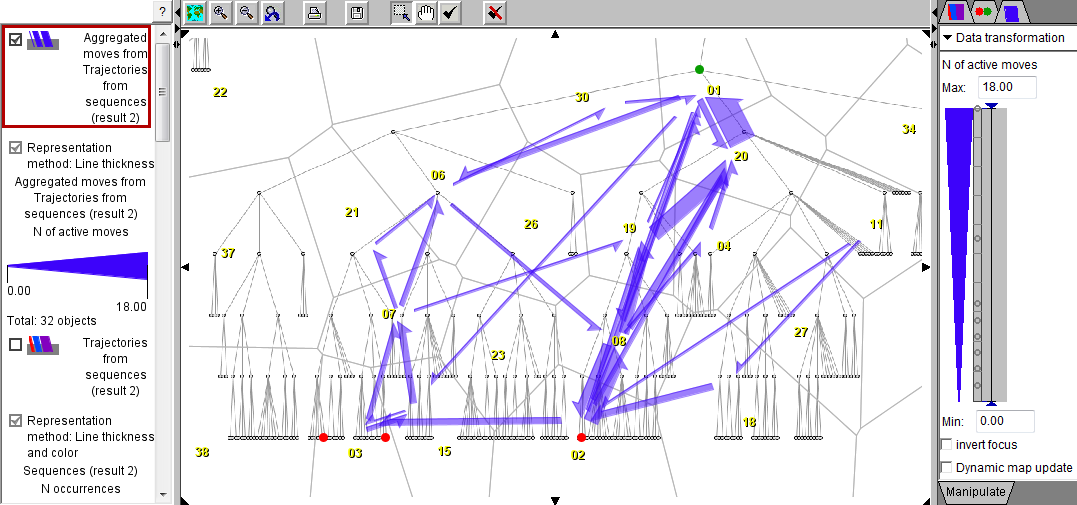
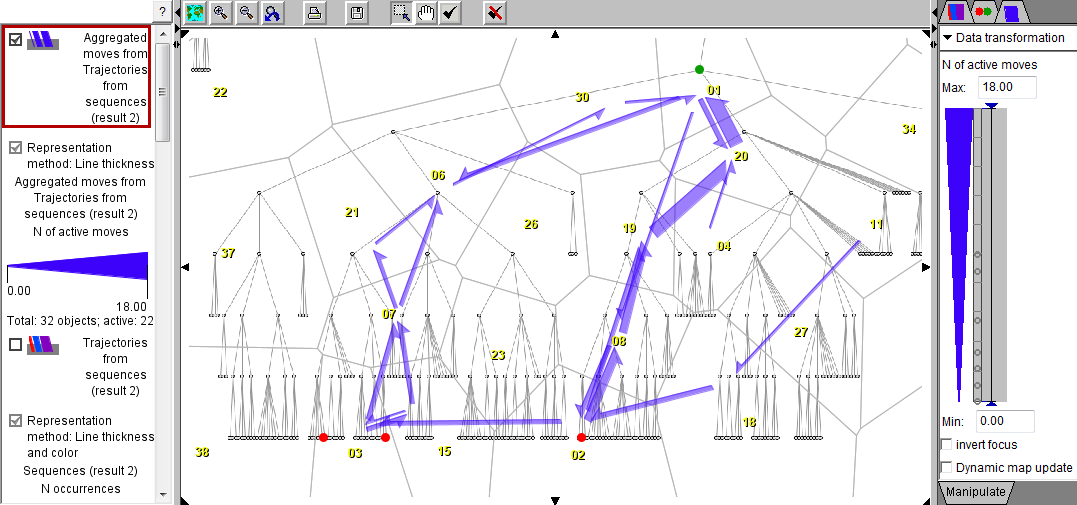
The trajectories generated from the frequent subsequences can be spatially aggregated and the results visualized in the form of flow map. The flow map below left represent the result of aggregating all repeated subsequences. By means of dynamic aggregation, it is possible to focus only on the subsequences without wildcards: the subsequences with wildcards are filtered out, the aggregates (flows) are dynamically recomputed, and the flow map is updated (right).
Reference:
I.Rigoutsos, A.Floratos.
Combinatorial pattern discovery in biological sequences: the TEIRESIAS algorithm.
Bioinformatics, 14(1), pp.55-67, 1998