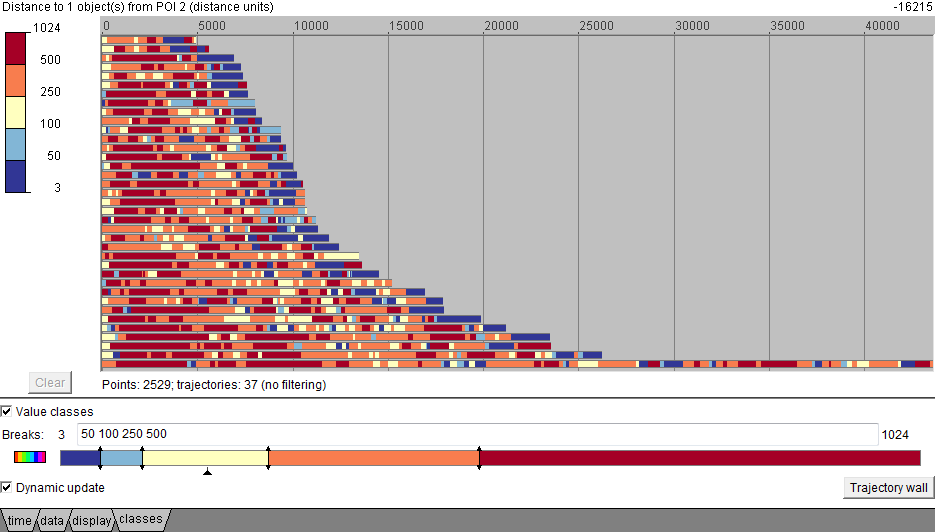
The horizontal dimension of the graph represents time. Time transformation can be used to aling the time references in the trajectories to a common start time, common end time, or to common start and end times.
The trajectories are represented by segmented bars. Different orderings can be used, such as by the duration of the task completion. The bar segments are colored according to the values of some attribute associated with the trajectory points. For example, this may be the distance from the trajectory points to a selected AOI (in our example images, to the target node, which the users were supposed to find). The range of the distances is interactively divided into intervals, which are assigned distinct colors. In our examples, non-linear color coding is used.
The TVT display is also an interactive interface for trajectory segment filtering.
In the image above the times of the trajectories are aligned to a common start time. Aligning the start times of eye trajectories is always reasonable since the absolute start times in the original data are not meaningful for the analysis. Aligning the start times means shifting the timelines of the trajectories to a common origin without changing the time units and durations of the trajectories.
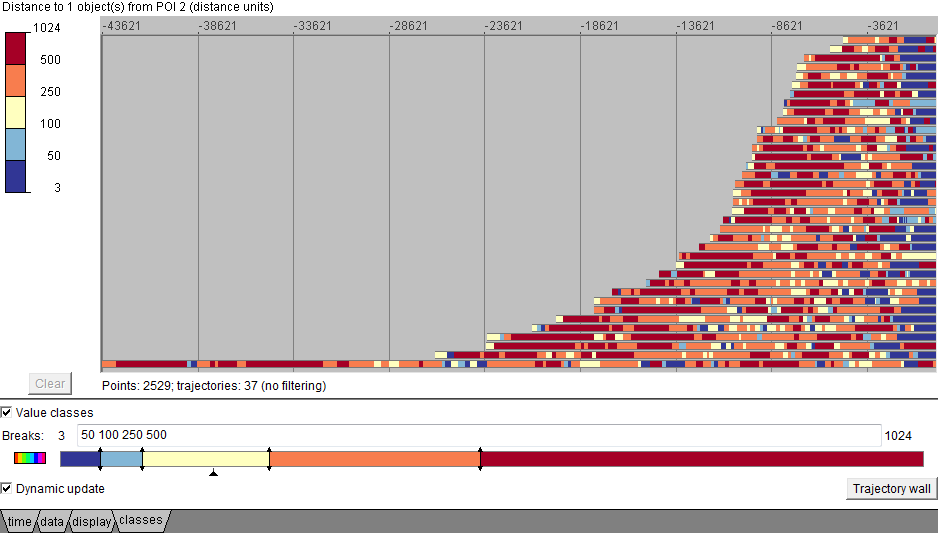
In the image above the times of the trajectories are aligned to a common end time. Aligning the end times may be useful when all users are supposed to come at the end to a certain target. In our example, all users need to find a certain graph node (target node); the temporal view shows the distances to this target node. Aligning the end times means shifting the timelines of the trajectories to a common end without changing the time units and durations of the trajectories.
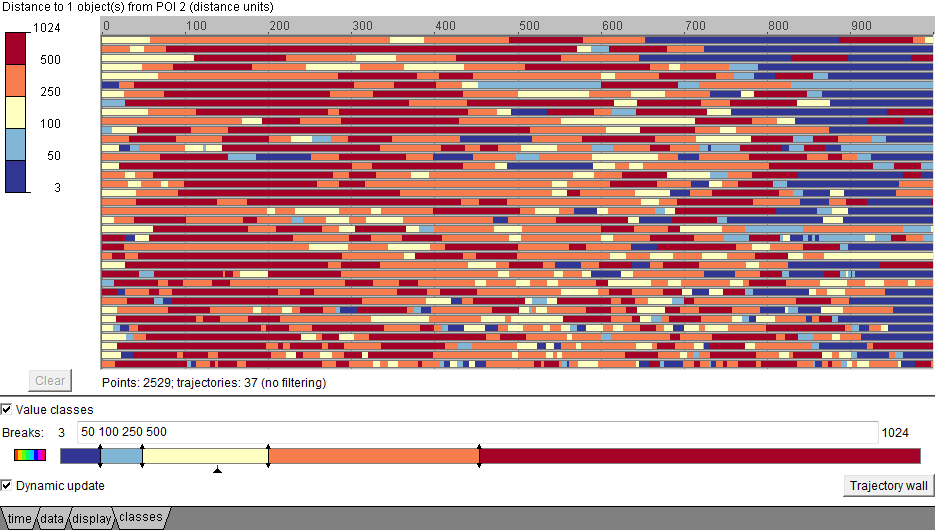
In the image above the times of the trajectories are aligned to common start and end times. Aligning both the start and end times allows the analysts to disregard individual differences in the viewing/searching speed and focus on the strategies used. Aligning both the start and end times means that the trajectories are equalized in duration and the time is no more measured in the original absolute time units but in fractions of the trajectory duration such as thousandths (per mille).
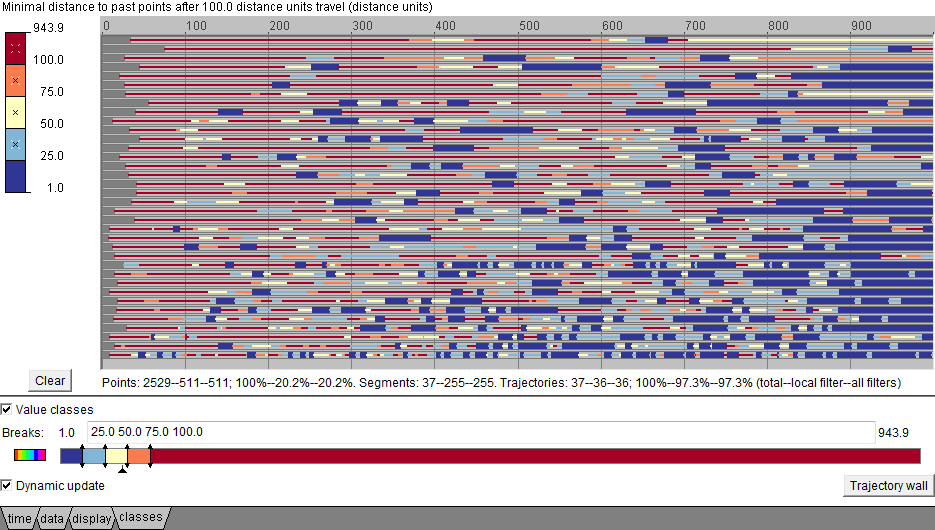
The legend on the left of the temporal view is simultaneously an interactive device for filtering. By clicking on the colored rectangles, the user can switch off some value intervals, which filters out the segments with the values from these intervals (see below). The filtering affects the map: only the points and segments of the trajectory that satisfy the filter remain visible (see below).
The temporal view of trajectories below represents the distances from the trajectory points to the previous trajectory points such that the travelled path from these points is not shorter than a chosen threshold (in our example 100 pixels). The bars representing the trajectories are ordered by increasing time of task completion. The bar segments colored in dark blue correspond to distances below 25 pixels. The dark blue is rare at the top of the display but its proportion increases towards the bottom. By applying the segment filter, we can see the repeatedly visited locations in the corresponding map.
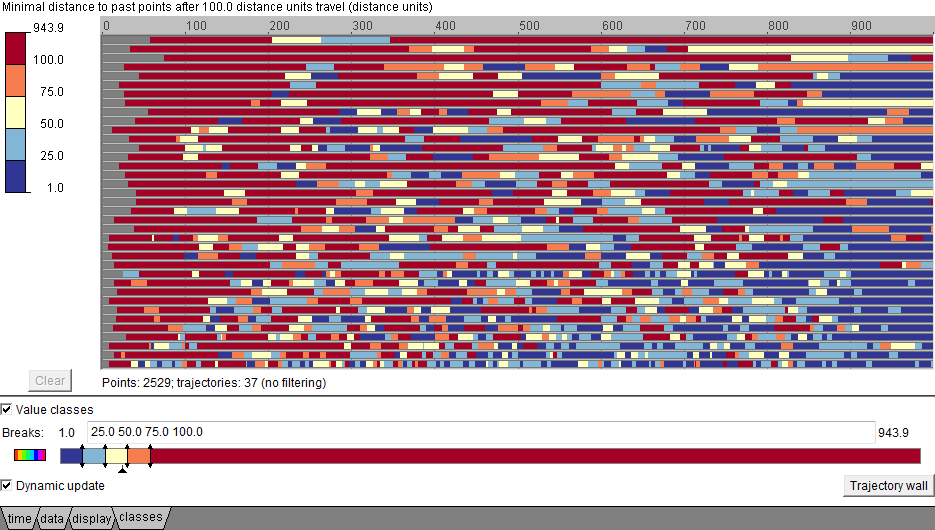
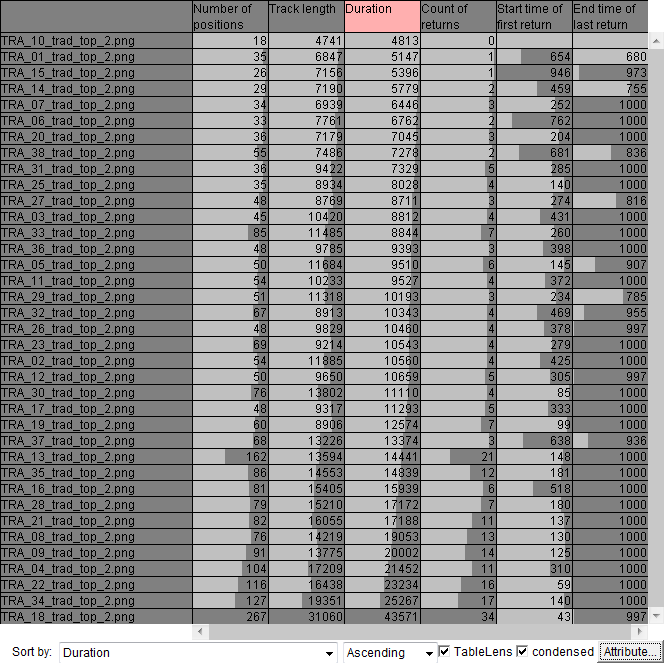
The segments satisfying the filter can be treated as spatial events. These events can be extracted from the trajectories into a separate dataset, which can be visualized on a map and in a space-time cube and analyzed independently from the trajectories or in combination with them. Statistics of the extracted events can be computed and attached to trajectories: event count, start time of the first event, and end time of the last event.
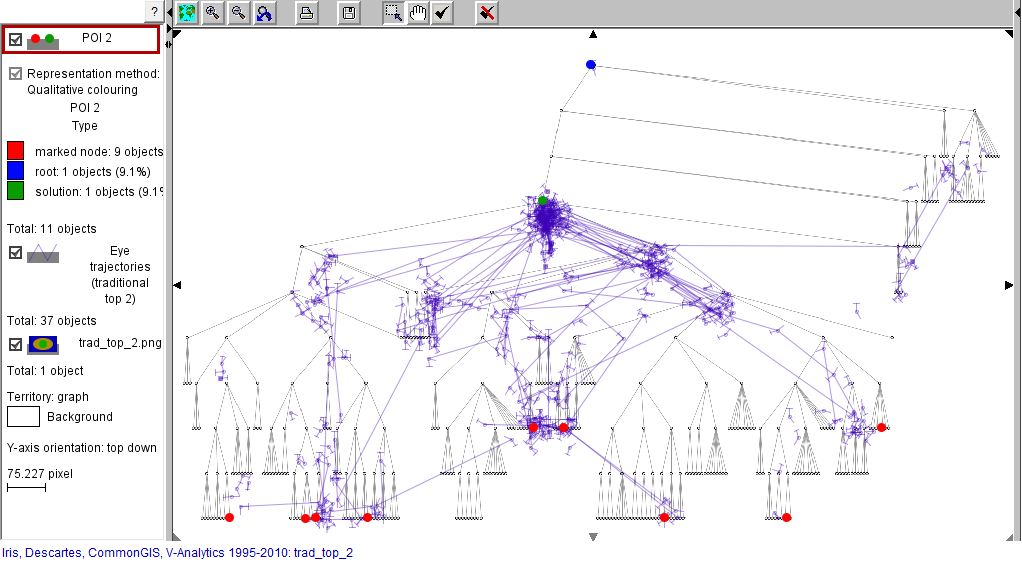
The space-time cube below shows the spatio-temporal distribution of the extracted events of returns to previously visited points. The table shows some of the previously attributes of the eye trajectories together with newly computed statistics of the extracted events: event count, start time of the first return, and end time of the last return. It can be see that the duration of the trajectories (i.e., the time of the task completion) is positively correlated with the number of returns to previously visited points.

Reference
Gennady Andrienko, Natalia Andrienko, Marco Heurich
An Event-Based Conceptual Model for Context-Aware Movement Analysis
International Journal Geographical Information Science, 2011, v.25 (9), pp.1347-1370
pre-print,
published version:
http://www.tandfonline.com/doi/abs/10.1080/13658816.2011.556120