The transformations used for geographic movement data are described in a survey paper [1]. Not all of them are meaningful for eye tracking data; particularly, transformations involving interpolation between recorded positions are inapplicable. Useful transformations are adjustment of time references, spatial generalization, and spatio-temporal aggregation.
Adjustment of time references means replacement of the original time stamps in the trajectories by new references derived in a certain way from the original ones. There are two classes of time transformations [2]: projecting onto temporal cycles and aligning the start and/or end times of multiple trajectories. Only the second class is applicable to eye tracking data. Aligning either the start or end times means shifting the timelines of the trajectories to a common origin or a common end without changing the time units and durations of the trajectories. Aligning both the start and end times means that the trajectories are equalized in duration and the time is no more measured in the original absolute time units such as milliseconds but in fractions of the trajectory duration such as thousandths.
Aligning the start times of eye trajectories is always reasonable since the absolute start times in the original data are not meaningful for the analysis. Aligning the end times may be useful when all users are supposed to come at the end to a certain target. Aligning both the start and end times allows the analysts to disregard individual differences in the viewing/searching speed and focus on the strategies used.
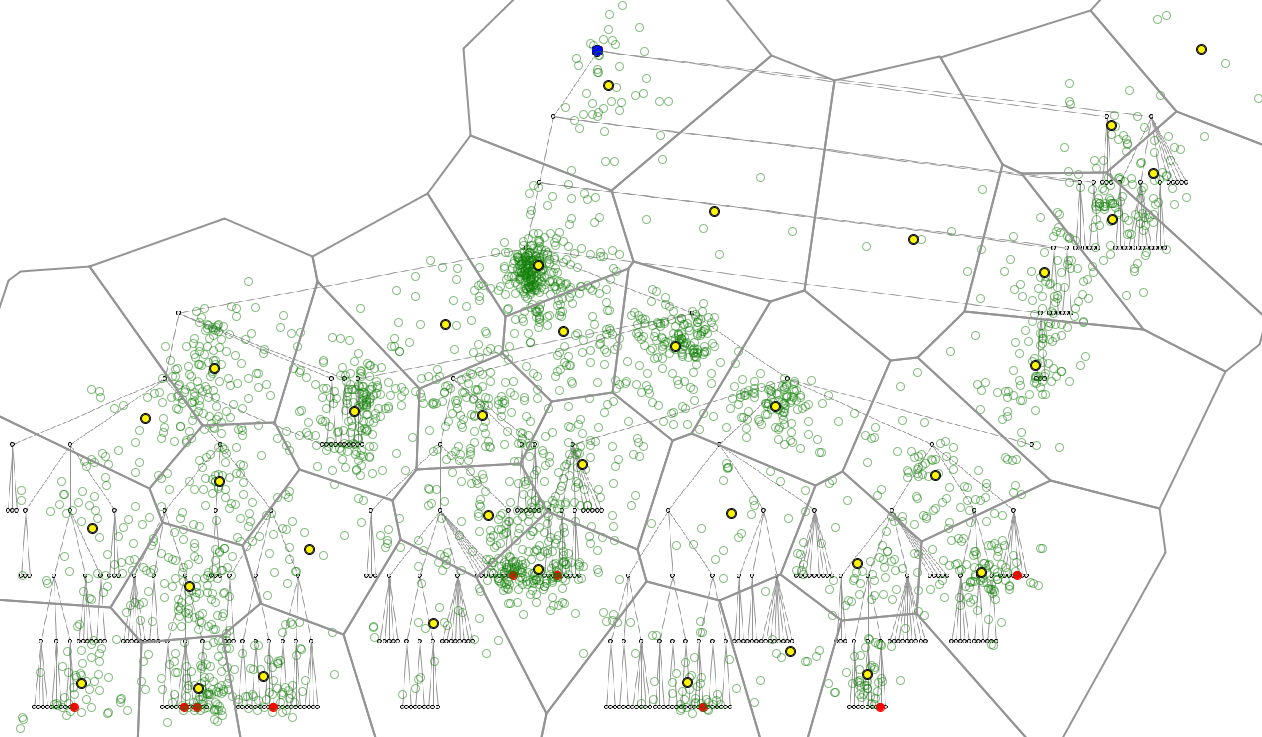
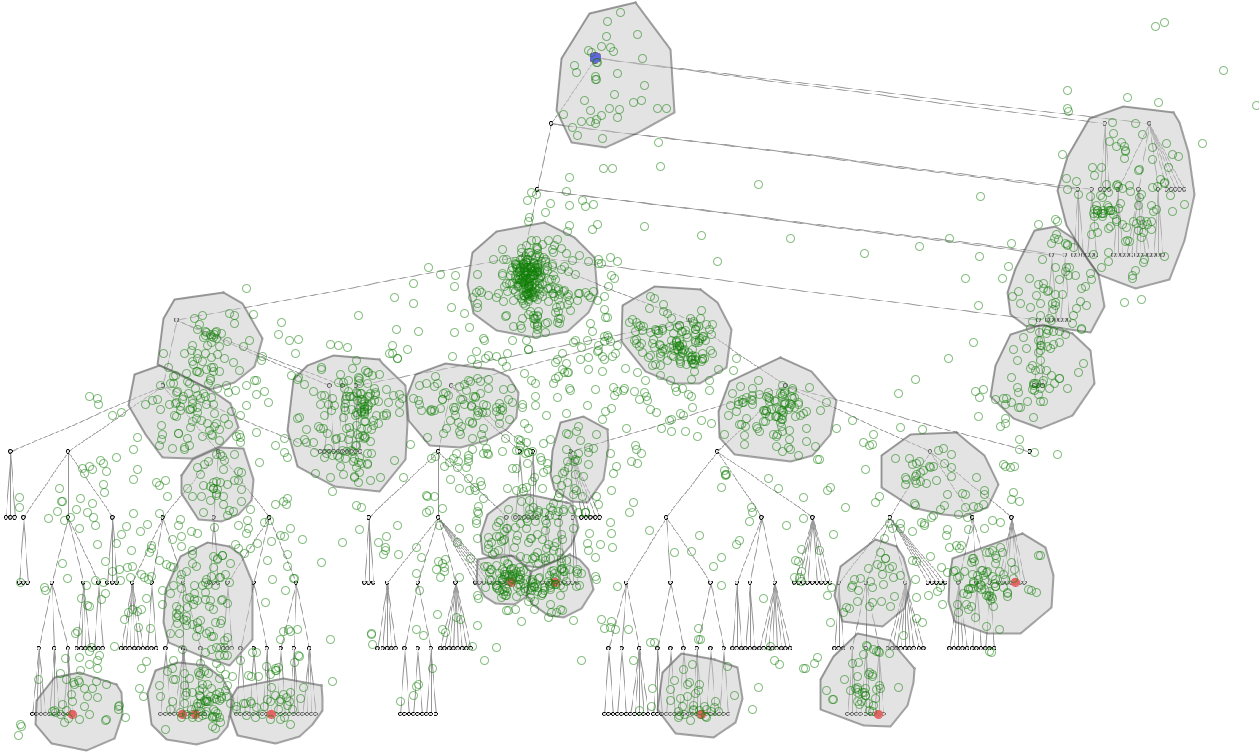
Spatial generalization means replacement of the original spatial positions in the trajectories by coarser space units, e.g., points by areas. Multiple trajectories are easier to compare after the transformation when the same set of space units is used for the generalization of each trajectory. The units may be obtained by means of space tessellation. Arbitrary regular grids may distort the spatial patterns and introduce geometric artifacts. Tessellation based on the spatial distribution of characteristic trajectory points may be more appropriate [3]. Another approach is to use areas (convex hulls or buffer zones) enclosing dense clusters of fixation points, which can be found by means of density-based clustering. Such areas can also be created interactively. The images below demonstrate two ways of space generalization: by automatic tesselation (on the left) and by interactive creation of areas of interest (AOIs) (on the right).
The generalization by AOIs, which do not cover the whole display space, ignores the trajectory points lying outside of all AOIs. The generalization based on space tessellation does not omit any trajectory point but several points may be grouped together and replaced by one area.
The main difference of eye movements from movements of physical objects governed by inertia is the presence of instantaneous jumps (saccades) over relatively long distances. The intermediate points between the start and end positions of a jump are not meaningful. It cannot be assumed that there exists a straight or curved line between two fixation positions such that the eye focus travels along it attending all intermediate points. Therefore, any method that explicitly or implicitly involves interpolation between positions is not applicable. In particular, aggregation of eye trajectories into smooth surfaces of movement density is not valid as this involves interpolation between trajectory points. Smooth density surfaces can be built based only on the eye fixation points, disregarding the moves between them. This is done in generating attention heatmaps, a standard technique for visualization of eye tracking data. Attention heatmaps show the distribution of user attention over the visual stimulus but do not show eye movements.
A valid method for aggregation of eye trajectories is discrete aggregation [3] using a finite set of places, such as compartments of space tessellation or previously defined AOIs (areas of interest). Trajectories are transformed into sequences consisting of visits of the places and moves (transitions) between them (this means that the trajectories are spatially generalized). Then for each place various statistics of the visits (i.e., eye fixations) are computed: count of visits, count of different visitors (users), total and/or average time spent in the place, etc. For each pair of places, statistics of the moves from the first to the second place are computed such as count of the moves and count of different users. By dividing the first count by the second the average number of moves per user is obtained. Aggregated moves are often called flows and the respective counts of the individual moves or objects (users) that moved are called flow magnitudes. Flows can be cartographically representes on flow maps.
In spatio-temporal aggregation, time is divided into intervals and the statistics are computed by these intervals. As a result, each place receives one or more time series of visit statistics and each connection (i.e., ordered pair of places for which at least one move exists) receives one or more time series of move statistics. Adjustment of the time references in the trajectories may be reasonable to do before performing spatio-temporal aggregation.
The presence of saccades in eye movement data makes them similar to episodic movement data. Aggregation provides a good possibility to visualize and explore such data [4].
Dynamic aggregation means dynamic re-computation of aggregate attributes of places and flows in response to any filter applied to the trajectories from which the aggregates have been computed. As soon as the aggregates are re-computed, all the displays representing them (such as attention and flow maps) are updated. The possible ways of filtering include filtering by time, space, thamytic attributes, object selection, object class selection, and others.