Generally, animated maps may be useful for displaying a clear spatio-temporal trend or coherent changes of multiple objects, e.g., coherent movement in the same direction with the same speed. Animated maps usually turn to be ineffective in other cases. In eye movement data there is large diversity among eye trajectories of different users, which makes the changes of animated displays appear chaotic and uncomprehensible. Exploration of a single eye trajectory may be easier, but the spatially discontinuous character of the movements (i.e., rapid jumps on long distances and frequent changes of the movement directions) makes even the eye movements of one user difficult to trace on an animated map.
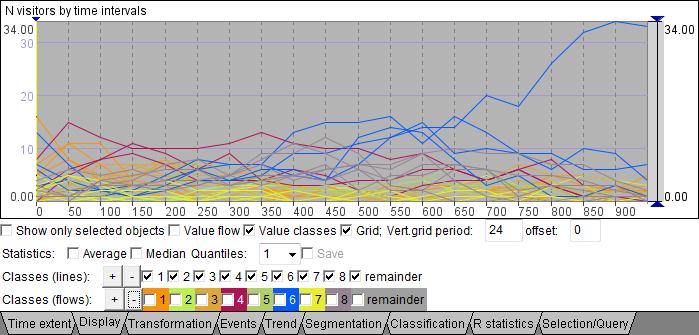
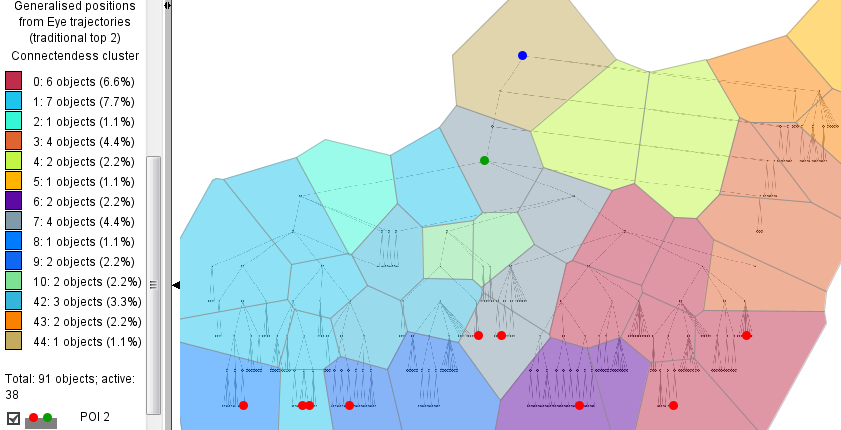
As a result of spatio-temporal aggregation, each generalized place (i.e., area of the visual stimulus) receives temporal series of one or more aggregate attributes, such as count of visits (i.e., eye fixations), counts of different users, average fixation duration, etc. For visualizing and exploring the dynamics of these attributes, the paper suggests multiple attention maps (MAM) and time clustering by similarity of attention distribution (CTA). We have also tried to apply the clustering in a different way: we have clustered the places by similarity of the time series [2]. For the data that were used for the tests, we found that the results of the clustering did not provide useful insights into the attention patterns, see the example below. The places on the map are colored according to their cluster membership. The time series that have been used for the clustering are shown in the time graph. they are also colored by the cluster membership. The time graph shows that there is high diversity among the attention dynamics in different places; therefore, there is also high internal variability inside the clusters. However, it cannot be excluded that the method may be effective for other movement data.
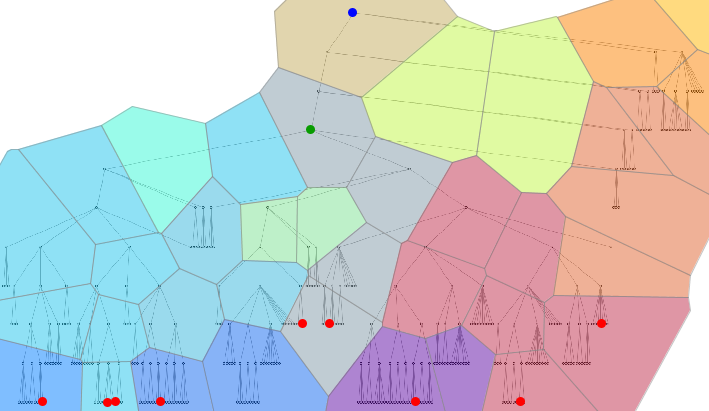
Places can also be clustered according to the strength of links between them. In the case of aggregated eye movement data, the count of eye moves between two places or the count of different users who moved their eyes between the places shows the strength of the link. On the basis of this attribute, we create a matrix of distances between the places and then use the procedure analogous to the clustering of trajectories by similarity. As a result, we obtain grouping (clustering) of places by the strength of the links. An example is shown below. Although the results are meaningful (i.e., interpretable spatial patterns are obtained), they do not provide additional information in comparison to flow maps.
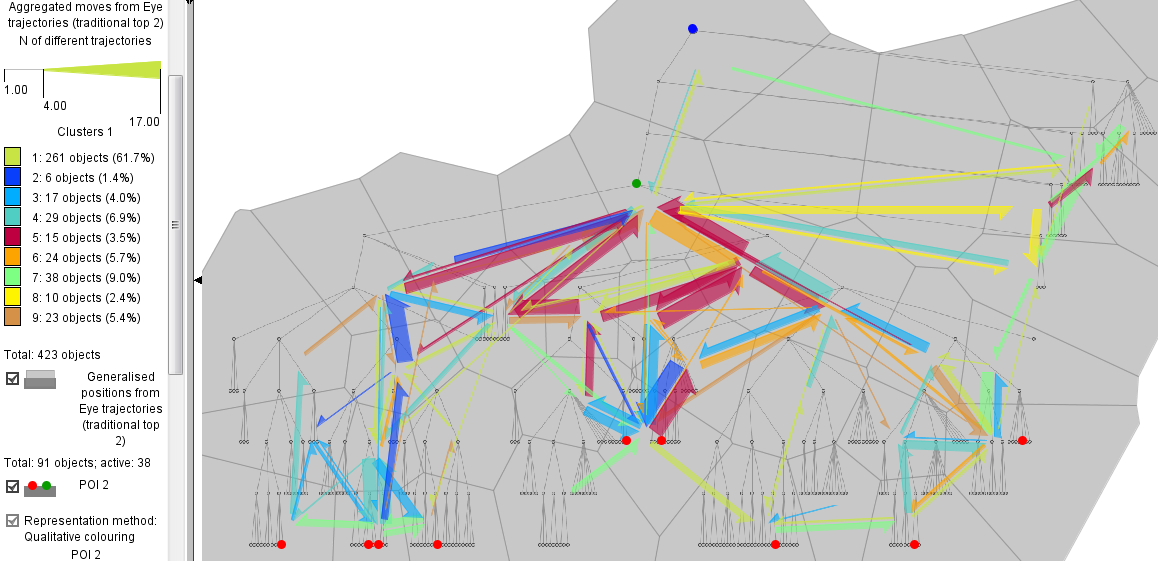
As a result of spatio-temporal aggregation, each connection between two places receives time series of one or more aggregate attribute values such as count of eye moves between the places or count of different users that moved their eyes between the places. Analogously to the clustering of places by similarity of the associated time series, it is also possible to cluster the connections (flows). An example is shown below. The map on the right is the result of applying dynamic filtering by the flow magnitudes. The colors of the flow symbols correspond to their cluster membership and the widths represent the counts of the different users that followed the connections. The results cannot be called meaningless; thus, some clusters may be associated with particular activities such as tracing the tree perimeter. However, the display of flow clusters is difficult to perceive due to the clutter; the use of different colors aggravates the clutter problem in comparison to usual flow maps where all flow symbols are colored identically. It can be recommended to explore the clusters of flows one by one. We find that the information that can be gained from clustered flows corresponds to what can be obtained from multiple flow maps; hence, there is no special need in clustering flows. Still, we do not classify this method as completely useless for eye movement studies.

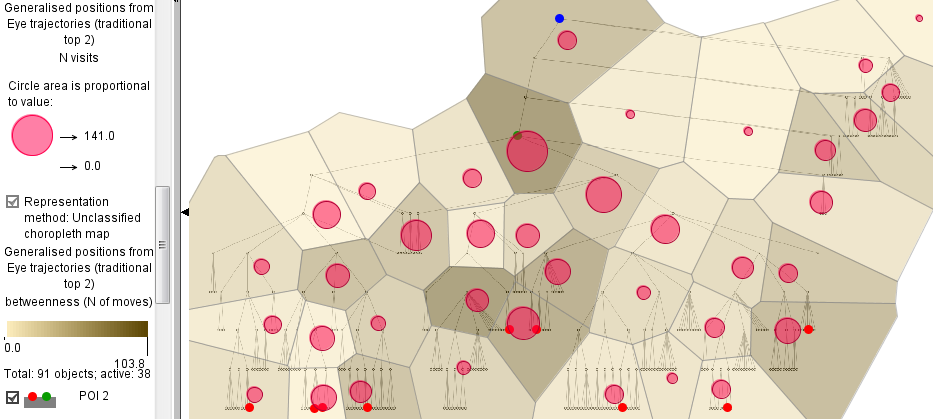
The result of spatial aggregation of movement data can be treated as a directed weighted graph where the nodes are the places (areas of interest), the links are the flows, and the link weights are the flow magnitudes. This movement graph should not be confused with the graphs that were used as visual stimuli in the particular data examples that we used. A movement graph results from aggregating any movement data, irrespective of the underlying space. This graph can be analyzed using methods of graph analysis. Among the available tools, we have tools for computing centrality measures of the graph nodes, i.e., places in our case. We tried to apply these tools. We computed the following measures: in-degree, out-degree, weighted in- and out-degree, closeness, betweenness, and clustering coefficient. We found that all these measures, except for the clustering coefficient, are highly positively correlated with the counts of place visits (i.e., the counts of eye fixations), and the clustering coefficient is negatively correlated. Among the positively correlated measures, the betweenness is the least correlated with the count of place visits. The computed measures can be visualized on a map display, but it is not immediately clear how the spatial patterns should be interpreted. An example is shown below. The places on the map are colored according to the betweenness and the proportionally sized circles show the counts of place visits.
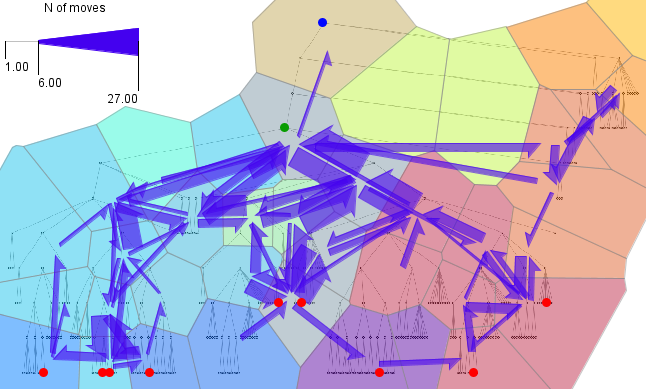
The technique is described in [3]. An example display is shown below. The displays shows summarized flows between groups of places, e.g. as in the map on the right, over multiple time intervals. The technique may be useful in exploring coherent movements of multiple objects; however, eye movements of different users are not coherent. As a result, the display is very cluttered and does not show clear patterns.