relation to display content or structure
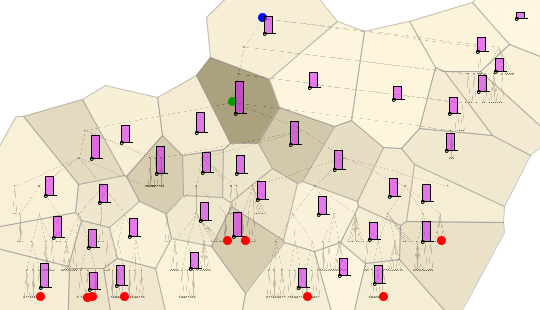
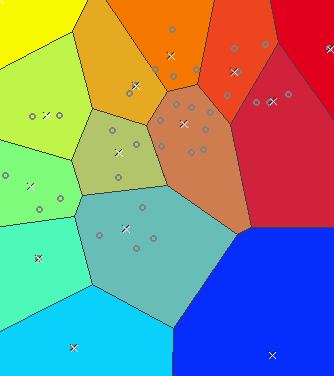
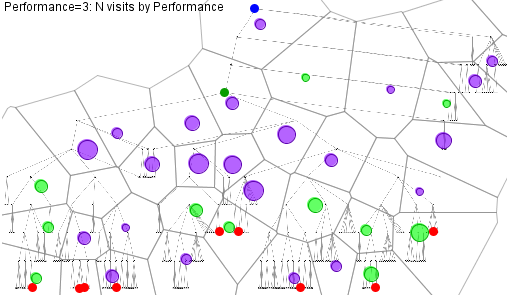
Map display of trajectories (MT)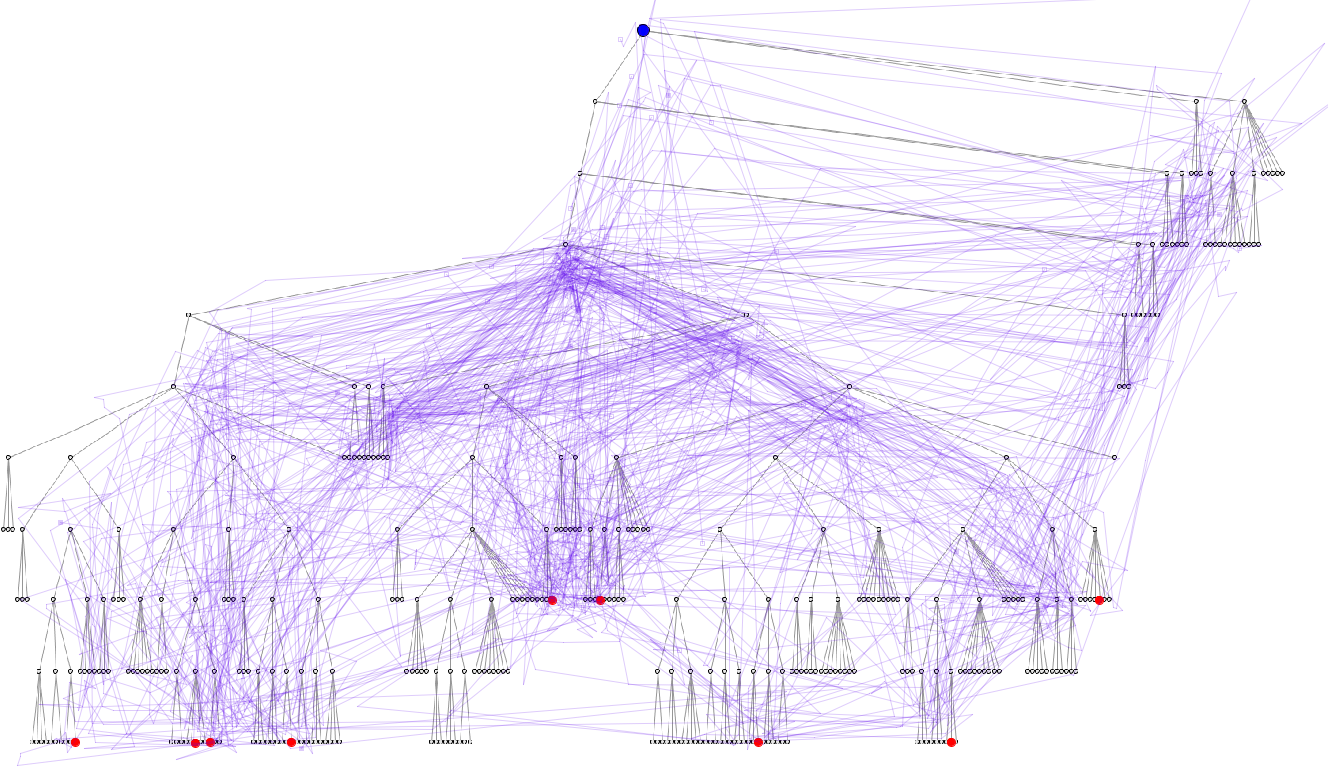 |
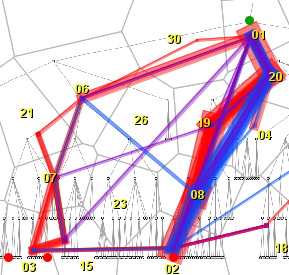
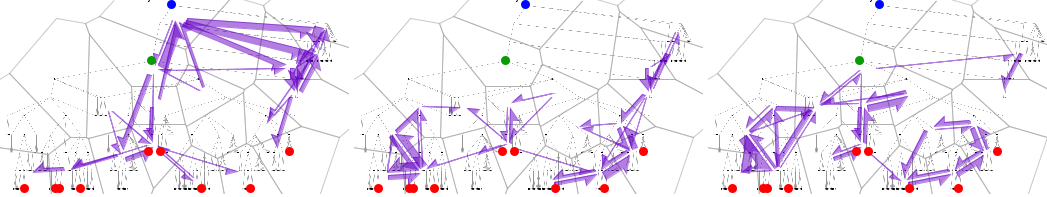
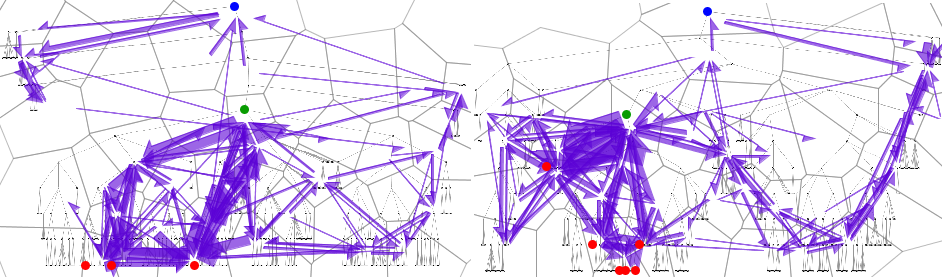
Flow map (FM)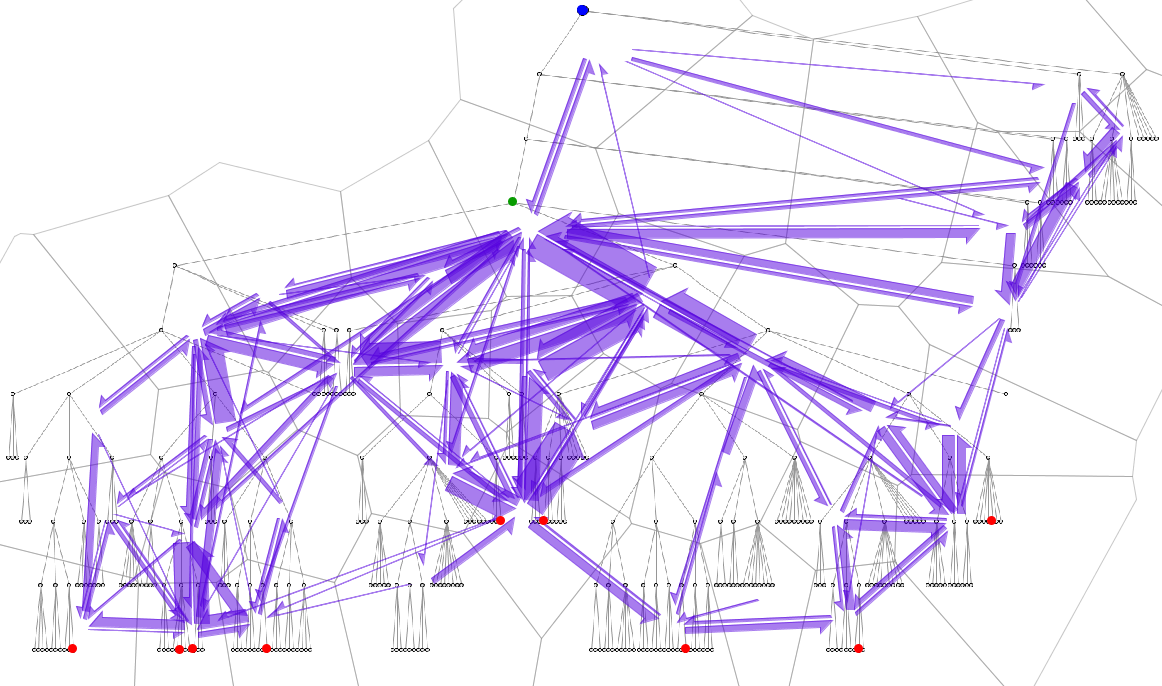
|
individual spatial pattern of movements;
relation to display content or structure;
individual search strategy
Map display of trajectories (MT) with interactive filtering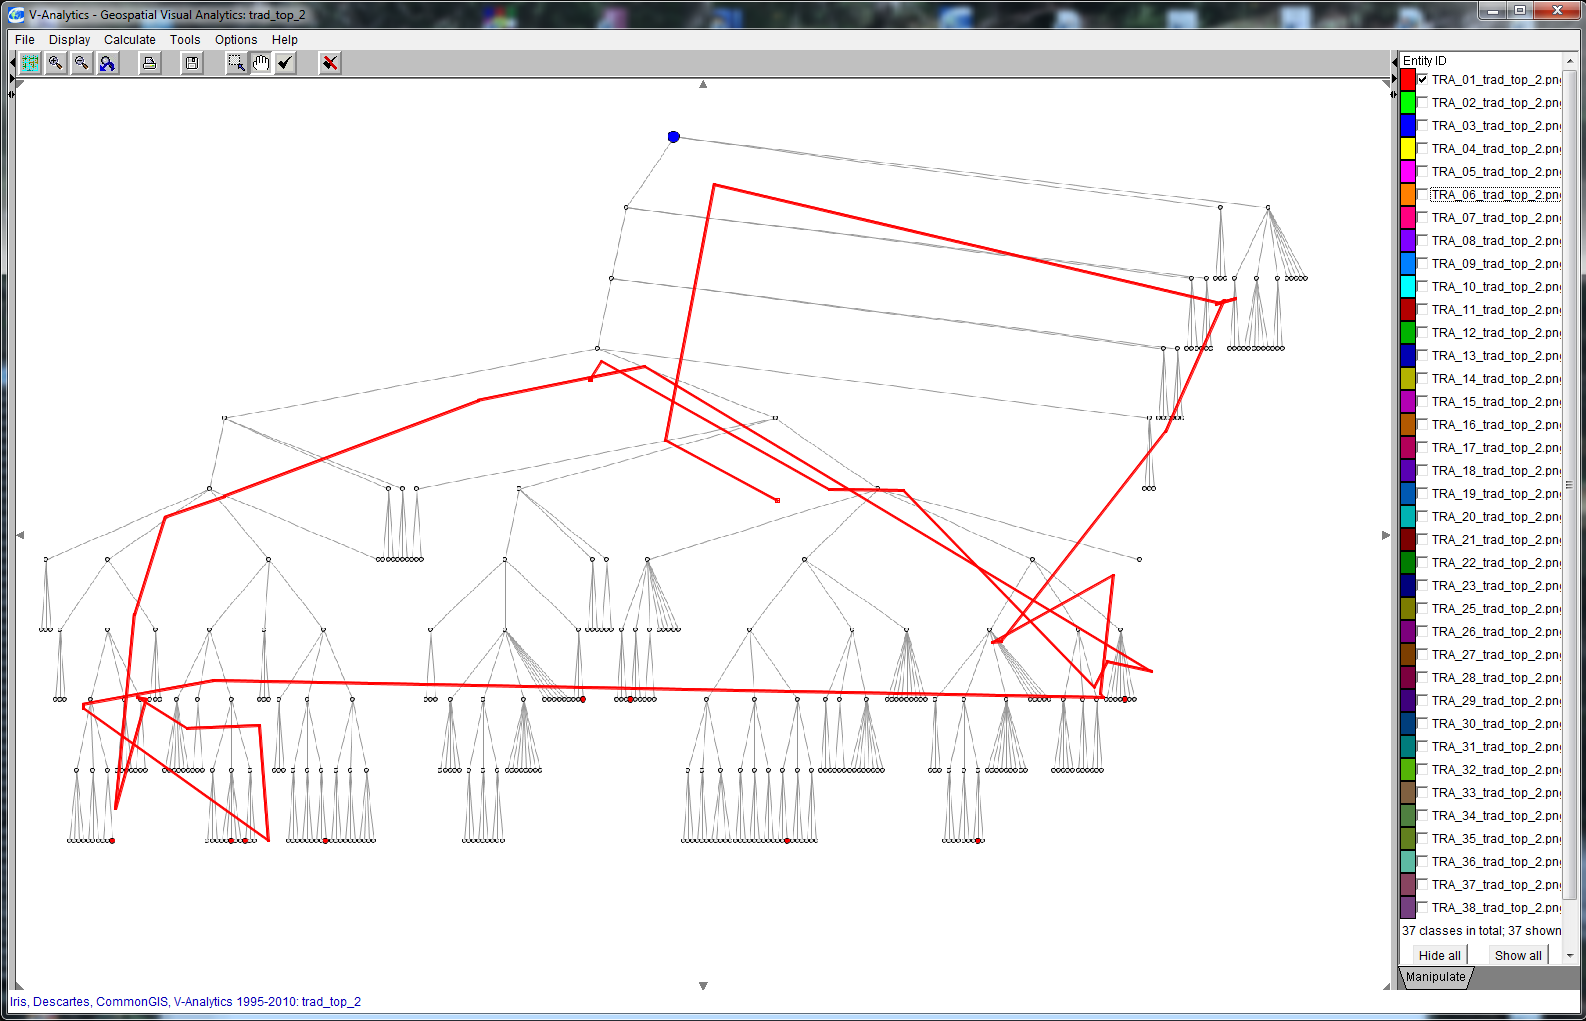 |
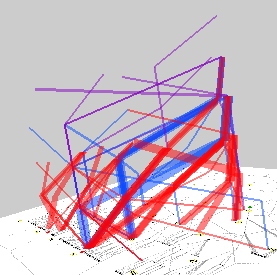
Space-time cube (STC)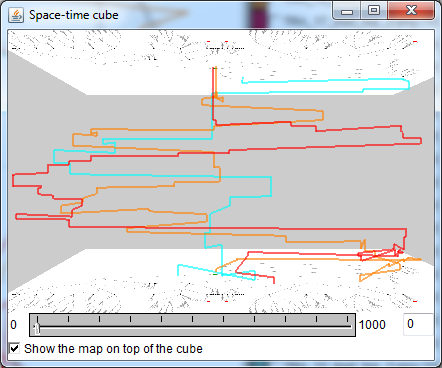 |
Flow map (FM) with interactive filtering and dynamic aggregation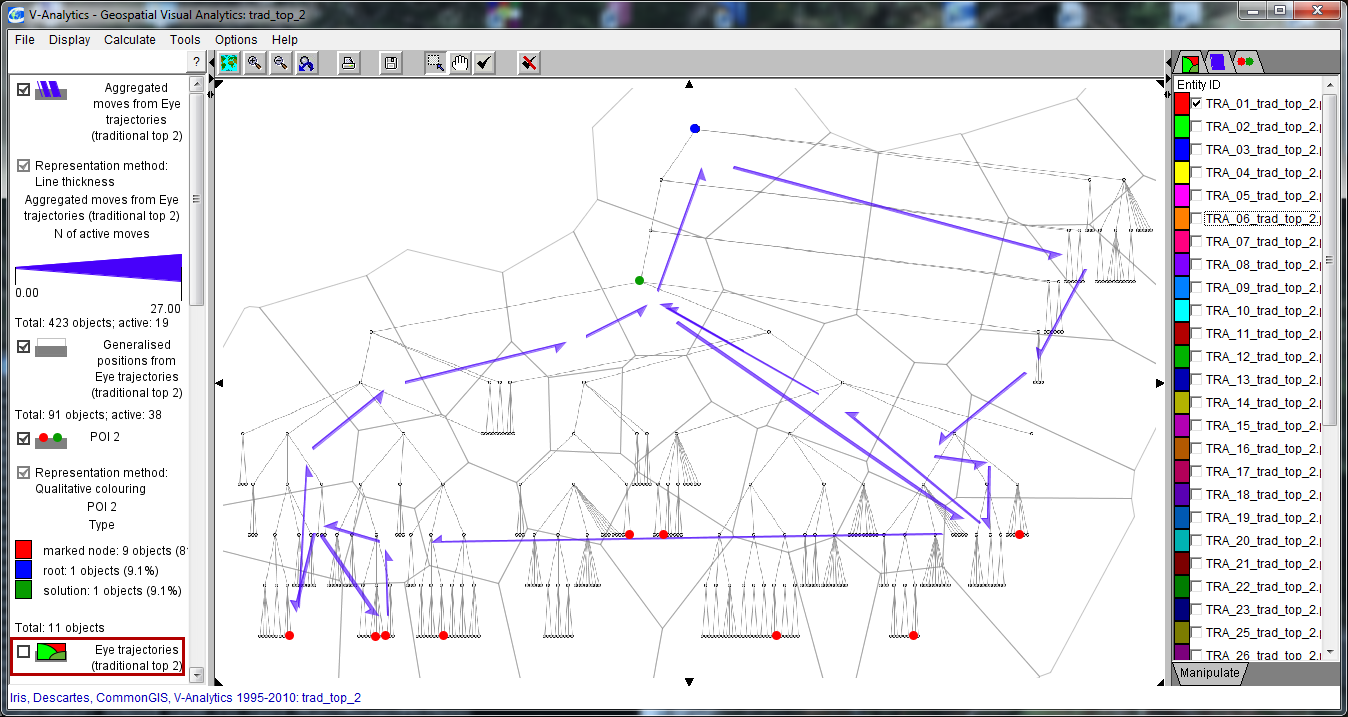
|
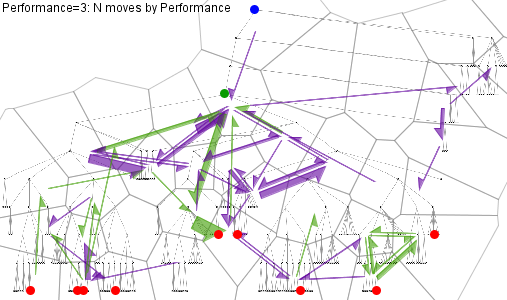
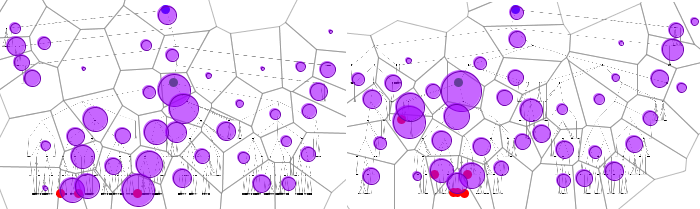
relation of attention foci to display content or structure;
repeated visits
Returns to previous points;
places where users have difficulties
Temporal view of trajectories (TVT)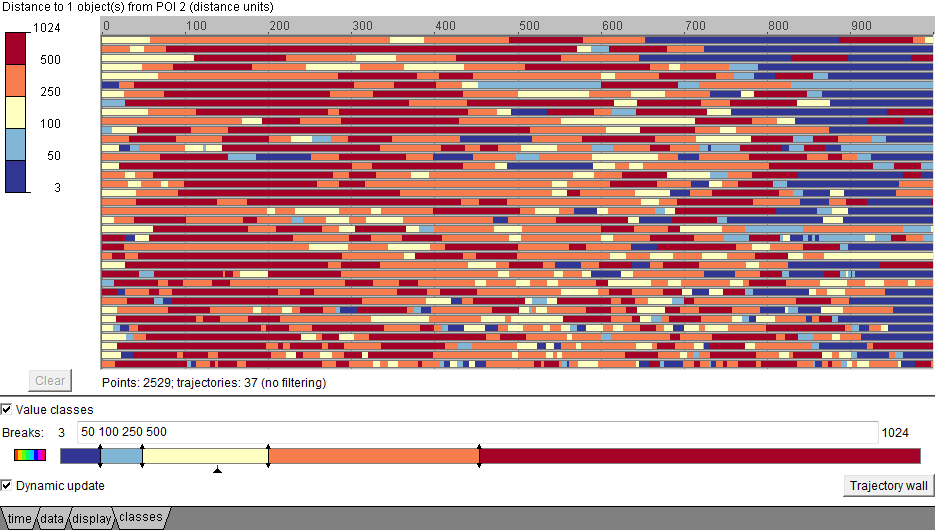 |
Trajectory segment filtering (TSF)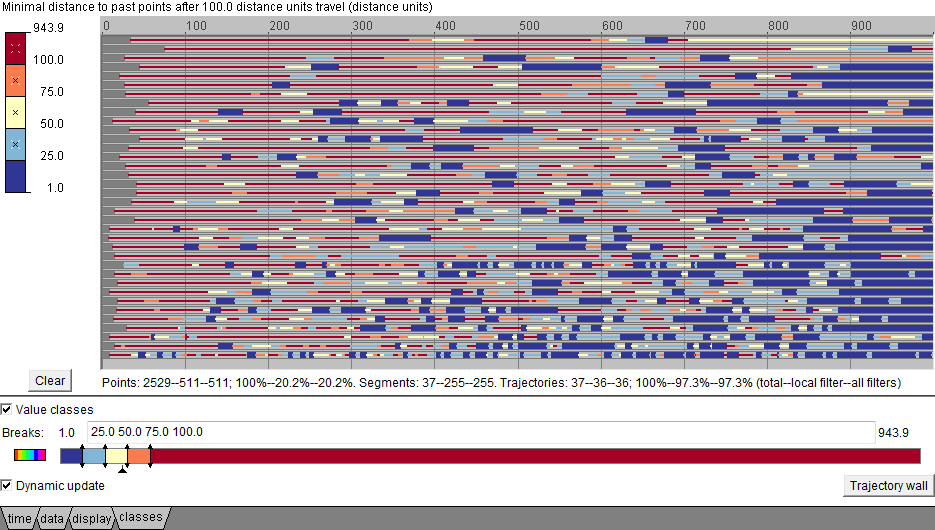 |
Map of filtered trajectory segments (MTF)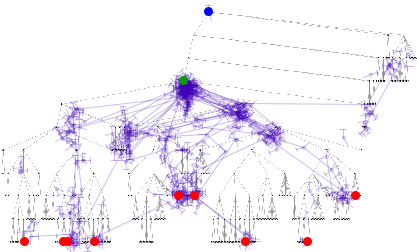 |
Extraction of events from trajectories (TEE) |
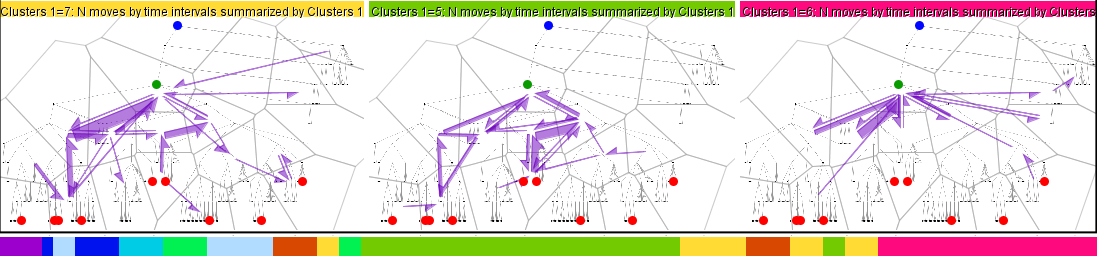
Presence and frequency of repeated moves
|
Map display of trajectories (MT) with interactive filtering
|
Space-time cube (STC) |
Flow maps of differences (FMD)
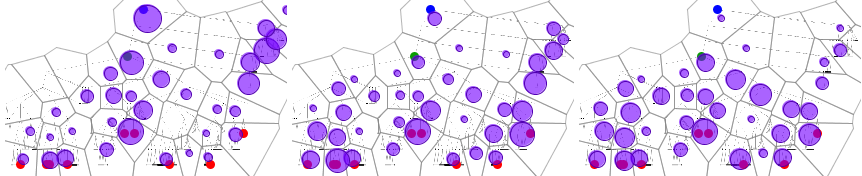
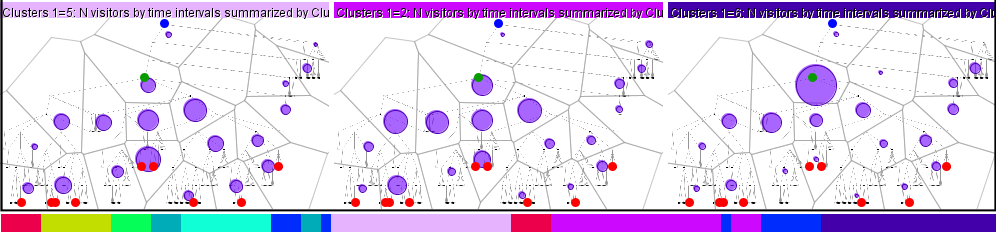
Attention maps of differences (AMD)
Time clustering by similarity of flows (CTF)
Time clustering by similarity of attention distribution (CTA)